Simplot
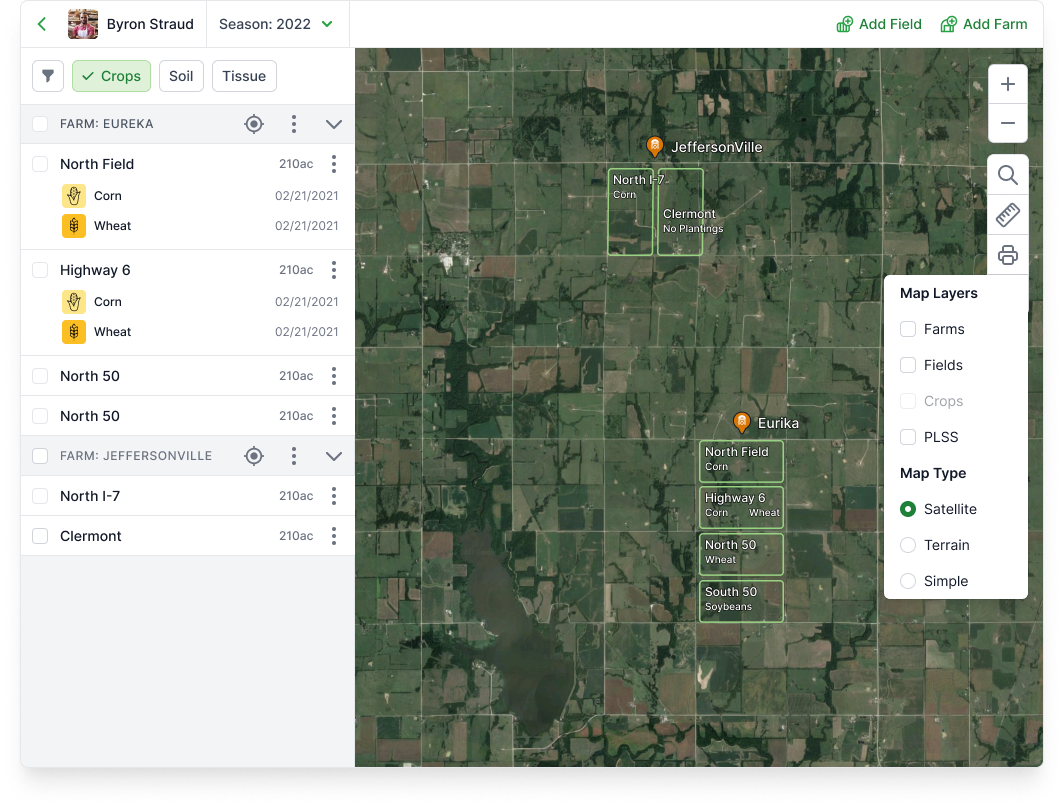
Simplot is a precision agriculture tool that lets farms harness the power of data and analytics to optimize their farms. This can range from marking fields infected with disease on satellite imagery, or viewing weak acres or harvest data.
I jumped into the project working with a Lead Designer who had been on the account for well over a year. All the features listed here are what I took from end to end and applied into the overarching systems at large.
MVP is to be released August 2023.
The Design System
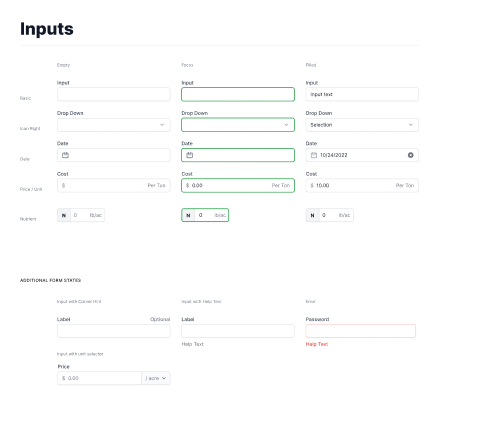
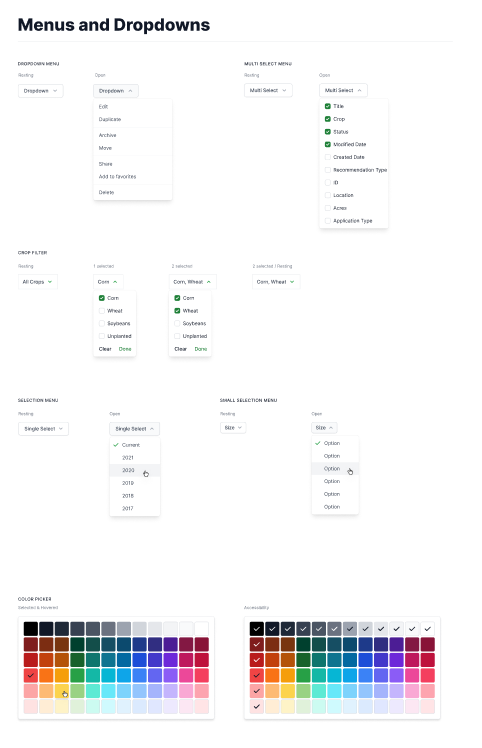
The Simplot design system has its roots in Tailwind but has since evolved from that to be its own unique version. Accents of green and grey help keep the complicated components looking simple, clean, and accessible.
We are constantly adding new pieces to the library but the whole system is devised from atoms, molecules and then the larger organisms and templates.
Scouting is a feature where someone in their car, or out walking in a field can make observations and place pins on a map accordingly.
Data such as onsite photos, severity of moisture or disease, and notes would all be attached to the pin data.
Scouting
Timeline: 2 weeks
Tools: Figma, Illustrator
The breadth of the feature.
Scouting itself is no small feature. (overview screenshot below) and this the mobile portion of the feature. We also not only had to design the userflow from very quick 48 hour discovery meetings but also illustrate and dream up the icons and illustrations for each observation.
With 14 different types of scouting observations including a null state when you are inputting a new observation, the feature quickly expanded from a simple ask to a large set of userflows.
Scouting a pest observation
Scouting a crop observation
Nutrient deficiency observation
Each observation had specific set of data that could be observed. Pests dealt with severity of infestation while crop conditions had more specific observations that could be made like fruit size and crop height. We needed to make sure was easy to understand and quickly able to be taken down by the user. Since Being in the field you don’t want to be figuring out the app you want to be productive and getting your observations down.
The Drawer
We created a drawer design that would be used on the map screens when scouting. There was a smaller use case of the drawer on previous features but this would be the heaviest usage of one yet. New components were made to illustrate the observations outside of the pin usecase.
We designed this to operate very similarly to the apple maps drawer but with our own spin.
Starting Point
A list view screen that was created for the sample soil features and sample tissue, was integrated as the starting point for scouting since it pertained to similar elements that fall into viewing the map.
Map Layer Viewing on Mobile
Timeline: 2 weeks
Tools: Figma, Illustrator
The different informational layers of the map needed to be displayed accordingly as well. Sattelite imagery, street view, and terrain are all aspects of the map that need to be shown while also viewing the corresponding pins from scouting
PLSS Overlay & Search
Timeline: 1 week
Tools: Figma
PLSS search is a system where townships and meridians are used with section numbers in order to establish coordinates for farm areas. This is different from Longitude and Latitude. It’s specifically used for farming.
Our task was to take existing functionality that farmers knew from Agvance and Optigrow and to translate it into an easier to use feature for the MVP in the Simplot product.
This was specifically a desktop and tablet feature that wouldn’t be available on mobile.


